BTC Price Prediction: Navigating Volatility Amid Technical and Fundamental Crosscurrents

#BTC
- Technical Positioning: BTC trades below key moving average but shows emerging positive momentum in MACD, suggesting potential consolidation near current levels
- Macro Sensitivity: Federal Reserve policy signals and institutional selling activity creating near-term headwinds for price appreciation
- Historical Patterns: Current 'danger zone' period historically associated with increased volatility, requiring careful risk management
BTC Price Prediction
Technical Analysis: BTC Shows Mixed Signals Near Key Support
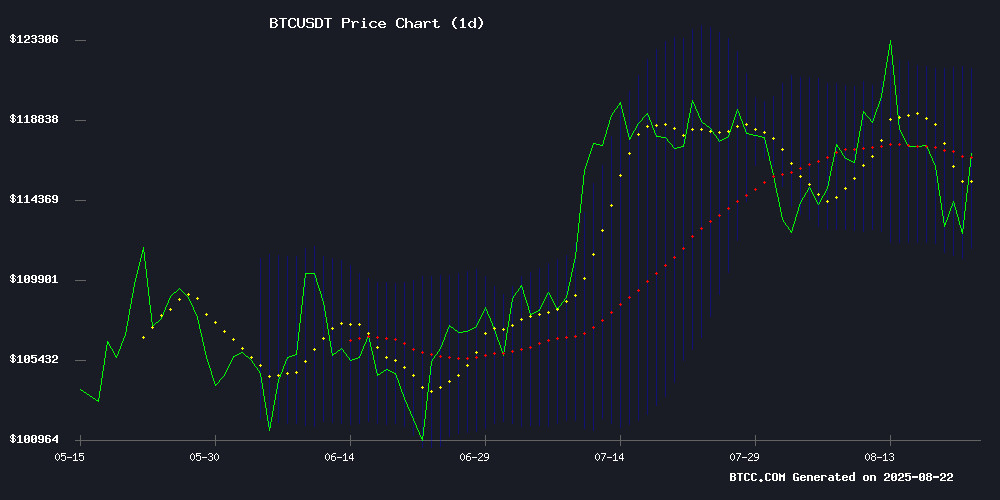
BTC currently trades at $113,109.72, sitting below the 20-day moving average of $116,490.96, indicating potential short-term bearish pressure. The MACD histogram shows positive momentum at +275.37, suggesting some buying interest despite the negative signal line. Price action NEAR the lower Bollinger Band at $111,208.15 could indicate an oversold condition, potentially offering support. As BTCC financial analyst Ava notes, 'The convergence around the lower band often precedes consolidation phases, with a break below potentially triggering further downside toward $108,000.'
Market Sentiment: Caution Prevails Amid Macro Events
Recent headlines highlight increased uncertainty surrounding Bitcoin. Federal Reserve Chair Powell's upcoming Jackson Hole speech creates anticipation for potential monetary policy clues that could impact risk assets. Meanwhile, MicroStrategy's CFO selling $20 million in MSTR shares adds to selling pressure concerns. Historical volatility patterns during these 'danger zone' weeks suggest traders should prepare for potential price swings. BTCC financial analyst Ava comments, 'The combination of macro events and internal selling pressure creates a cautious environment, though oversold conditions may limit immediate downside risks.'
Factors Influencing BTC's Price
Bitcoin's Jackson Hole Test: Powell's Speech and BTC Price Volatility
Federal Reserve Chairman Jerome Powell's upcoming speech at Jackson Hole has traders anticipating modest volatility for Bitcoin. Options markets suggest a ±2.0% price swing—slightly above Bitcoin's 30-day average volatility of 1.52%.
Implied volatility metrics tell the story. The Volmex one-day index (BVIV1D) spiked to an annualized 49%, signaling the market's heightened sensitivity to macroeconomic cues. This translates to a 2.5% potential move—direction unknown, though downside risks appear more pronounced.
"BTC options are pricing in about a ±2.0% move around Powell’s Jackson Hole speech," said Pulkit Goyal of Orbit Markets. The crypto derivatives specialist notes this exceeds typical daily churn but falls short of extreme event volatility.
MicroStrategy CFO Andrew Kang Sells $20 Million in MSTR Shares Amid Market Pressure
MicroStrategy's CFO Andrew Kang has offloaded approximately $20 million worth of MSTR shares in August 2025, triggering market speculation about the company's outlook. The sales included multiple large transactions, with the most notable being a $7.4 million sale on August 7 at an average price of $395 per share. Kang also engaged in simultaneous buying and selling activities on the same day, executing three batches of 6,250 shares at varying prices.
Earlier transactions reveal a pattern of strategic disposals, including a $2.3 million sale in May and smaller trades in June. While Kang purchased shares at lower prices in prior months, the scale of recent sales has raised eyebrows. The moves coincide with broader volatility in Bitcoin-linked equities, as MicroStrategy remains one of the largest corporate holders of BTC.
Bitcoin Enters Danger Zone Weeks: Analysts Flag Historical Volatility Patterns
Bitcoin's price action is mirroring historical cycles as it approaches a critical juncture. Analyst Benjamin Cowen notes the current cycle has reached day 1,016 - putting October-December in focus for a potential market top. Previous cycles peaked around 1,060 days.
Rekt Capital's week-by-week analysis reveals striking parallels: 2013 saw a six-week rally before a 7th-week correction, while 2017's seven-week uptrend collapsed 34% in week eight. The 2020-21 cycle followed a similar six-week pattern before a 30% pullback.
The cryptocurrency now enters what analysts term 'danger weeks' - a period where extended rallies typically precede sharp corrections. October presents particular intrigue as Bitcoin has never peaked during this month, despite November and December hosting previous cycle tops.
Is BTC a good investment?
Based on current technical and fundamental analysis, BTC presents both opportunities and risks for investors. The current price of $113,109.72 sits near technical support levels, while mixed signals from indicators suggest potential consolidation.
| Metric | Value | Interpretation |
|---|---|---|
| Current Price | $113,109.72 | Below 20-day MA, near support |
| 20-day MA | $116,490.96 | Resistance level |
| MACD Histogram | +275.37 | Positive momentum building |
| Bollinger Lower Band | $111,208.15 | Key support level |
As BTCC financial analyst Ava suggests, 'Long-term investors might find current levels attractive for dollar-cost averaging, while short-term traders should watch for a clear break above $116,500 or below $111,200 for directional clarity.'
